Our experience and wide range of geochemical services is geared towards reducing your exploration risk.
The Microseepage Model
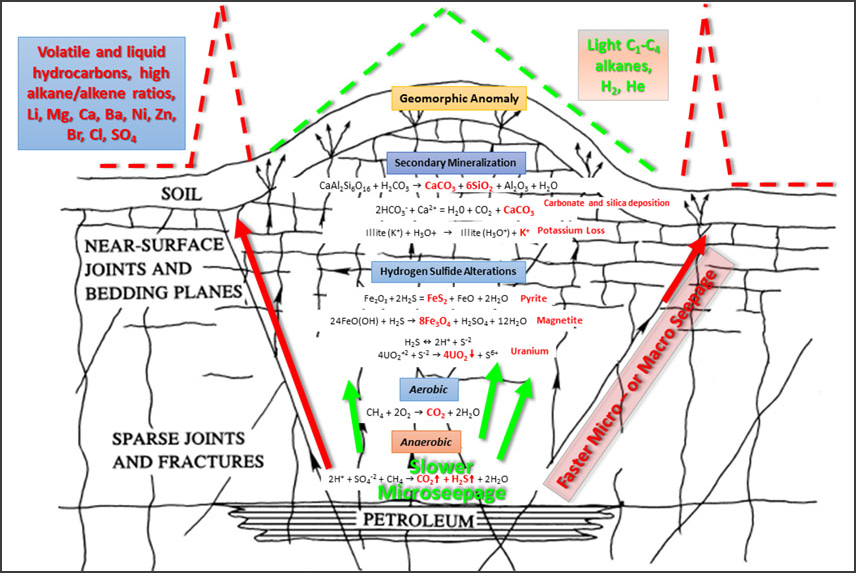
The microseepage model favored by Geochemical Insight for the ascent of hydrocarbons from reservoir to surface is a modified version of that proposed by Saunders et al (1999). In this model (Figure 1), volatile compounds (C1-C4, H2, He) gradually (“slow microseepage”) ascend to surface along bedding planes and joints forming apical anomalies. If faults connect the reservoir with surface, then volatile and liquid hydrocarbons (with high alkane/alkene ratios) and various major and trace elements can ascend to surface rapidly along these permeable fairways. Carbon dioxide and hydrogen sulfides formed through bacterial degradation of hydrocarbons and sulfates result in the deposition of pyrite, magnetite and uranium minerals to produce induced polarization, magnetic and radiometric anomalies respectively. High levels of carbonic acid (from high CO2) in the groundwater over petroleum deposits results in the precipitation of carbonate and silicate cements producing geomorphic anomalies.
FIGURE 1 / Microseepage model modified after Sanders et al (1999). Lighter volatile compounds (C1-C4, H2, He) gradually ascend to surface along bedding planes and joints forming apical anomalies. If faults connect the reservoir with surface, then volatile and liquid hydrocarbons (with high alkane/alkene ratios) and various major and trace elements can ascend to surface rapidly along these permeable fairways. Carbon dioxide and hydrogen sulfides formed through bacterial degradation of hydrocarbons and sulfates result in the deposition of pyrite, magnetite and uranium minerals to produce induced polarization, magnetic and radiometric anomalies respectively. High levels of carbonic acid (from high CO2) in the groundwater over petroleum deposits results in the precipitation of carbonate and silicate cements producing geomorphic anomalies (i.e. hills).
Soil Gas and Groundwater Samples
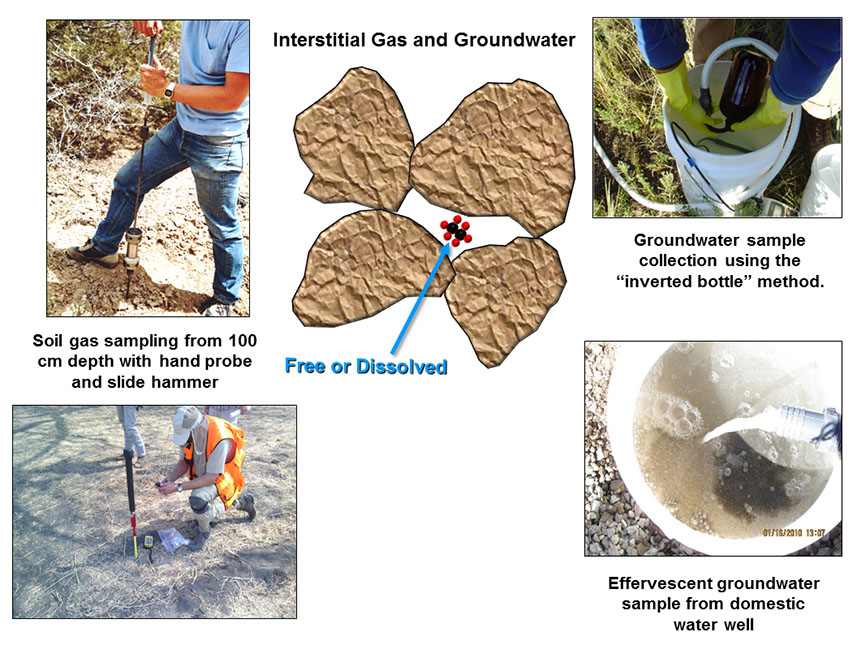
Soil gas and groundwater reside in interstitial pore spaces of un-saturated and saturated soils. Soil gas samples are collected in the vadose zone from at least 100 cm depth using a specialized hand probe. The gas is collected with a syringe and forced into 20 ml glass vials with air-tight crimped lids. The samples are analyzed back at the laboratory for C1 to C4 hydrocarbons by GC-FID and for fixed gases (H2, CO2, CO, O2 and N2) by GC-TCD and for helium by mass spectrometry (Table 2).
Groundwater is a very uniform sample medium for geochemical exploration surveys for oil & gas, helium and mineral deposits. Areas with abundant domestic and stock water wells allow for the best survey coverage, but even monitoring wells around mineral deposits can be used to analyze for pathfinder elements to mineralization (Muntean and Taufen, 2011). Groundwater samples are collected and preserved according to USGS NAWQA protocols (Figure 2). The samples can be analyzed for dissolved hydrocarbons, carbon and deuterium isotopic rations in the hydrocarbons, fixed gases (H2, He, CO2, O2, N2) and several major and trace elements (Table 2). Although, groundwater has been used successfully to find mineralization under transported cover in Nevada, most of the groundwater literature related to oil fields pertain to the geochemistry of oil field brines and environmental issues, rather than exploration.
FIGURE 2 / Interstitial or pore space sample media include soil gas and ground water. Either media can be analyzed for dissolved C1-C4 hydrocarbons and fixed gases (H2, He, CO2, CO, and N2) and stable isotopes of carbon (δ13C) in hydrocarbons and CO2 and hydrogen in hydrocarbons ((δD) to help determine their origin. Groundwater can also be analyzed for major and trace elements to help establish its source.
Soils, Shot-hole and Lake Sediments
Soils are collected from at least 50 cm depth with a spade or auger and stored in clearly labeled plastic jars or Ziploc bags for transport back to the laboratory (Figure 3). Shot-hole sediments are collected seismic crews from greater depth (3 to 20 meters) while the shot-holes are being drilled (Figure 3). The sediments are stored in 500 ml plastic jars for shipment back to the laboratory. Lake sediments are collected with a gravity corer at least 50 cm beneath the lake floor. The gravity corer is dropped from the pontoon of a helicopter or boat (Figure 3). Upon retrieval, about 250 ml of lake-bottom sediment is immediately transferred to a plastic jar with a septum on the lid. The remaining jar volume is filled with deionized water and bactericide, and room (10 ml) is left at the top to be able to withdraw a headspace sample back at the laboratory.
The soil and shot-hole sediment samples can be analyzed for acid-extractable (occluded) and/or headspace (sorbed) hydrocarbons in the C1 to C5 range (Table 2). The samples can also be tested for oil microseeps using the Synchronous Scanned Fluorescence technique (SSF). Lake sediments, because of their wet, organic-rich character are generally analyzed only for headspace hydrocarbons. All of these sample media can also be analyzed for major and trace elements by ICP/ES-MS (Table 2).
The acid-extraction method liberates gases occluded in the carbonates of soils and shot-hole sediments, which are then analyzed for volatile (C1 to C4 alkanes and alkenes) and liquid (C5 alkanes) hydrocarbons by GC-FID (Table 2). The carbonates in these soils and sediments could have been deposited from carbonic acid rich groundwater (Figure 1), and the carbon in the carbonates could therefore have a thermogenic isotopic composition (Donovan,
The headspace (sorbed gas) method uses heat and agitation to release weakly sorbed and interstitial hydrocarbons to the headspace for subsequent GC-FID analysis for C1 to C5 alkanes and alkenes (Table 2). This method works well for wet, organic-rich, fine-grained soils and sediments that can hold on to their hydrocarbons.
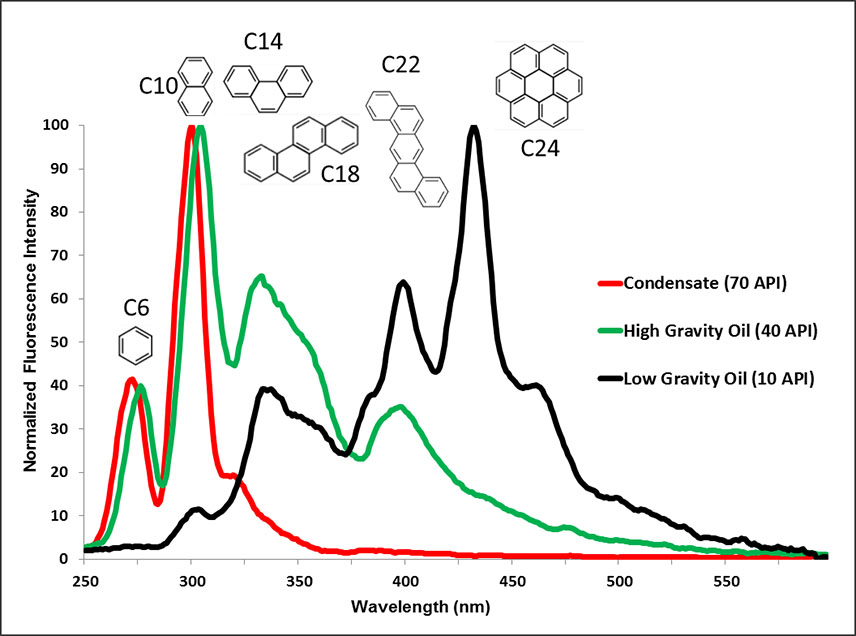
Synchronous Scanned Fluorescence (SSF) is a cost-effective way to analyze soils for traces of the heavier C6-C24 liquid aromatic hydrocarbons (i.e. oil). Crude oils contain various proportions of aromatic hydrocarbons. These compounds are more stable at surface than alkanes (e.g. ethane, propane, etc.) because of higher boiling points and bacteria, yeasts and molds prefer to metabolize alkanes to aromatics. These aromatics are water-soluble and can therefore ascend vertically through fractures to accumulate at surface in oil microseeps. The limited degradation of aromatics at surface means their compositional character may provide clues to reservoir fluid composition. Organic solvent extracts of soil and sediment samples are scanned at wavelengths ranging 240 to 600 nm. The hydrocarbons that fluoresce in oils are the ringed aromatic compounds and can be grouped by the number of (benzene type) rings chained together. These groups have fluorescence spectra maxima that increase in wavelength with increasing ring numbers as shown in Figure 4. Fluorescence spectral patterns from the analysis of soil samples are compared with known high, medium or low gravity oil standards and then are assigned a rank to express how similar the spectral patterns are to a particular oil standard. In many cases, oil from producing wells near the survey area is available for fluorescence analysis to compare with micro or macroseeps identified in soil and sediment samples.
FIGURE 3 / Soils and shot-hole and lake sediments for headspace (sorbed) and/or acid-extractable (occluded) C1-C5 hydrocarbons and major and trace elements
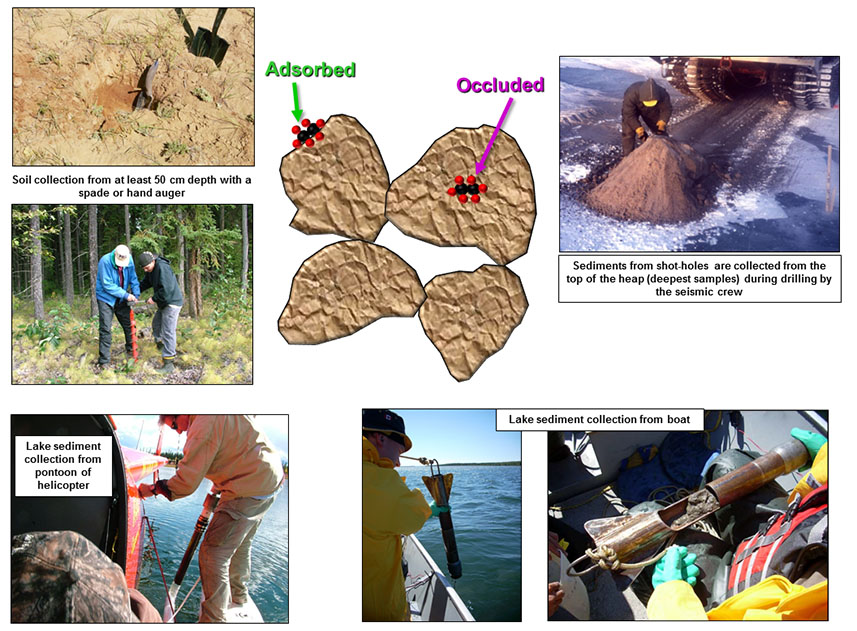
FIGURE 4 / Synchronous Scanned Fluorescence spectra of condensate and crude oil. These fluorescence spectra can be compared and contrasted with micro- and macro-seeps in surface soils and sediments to estimate the likely source of the seeps.
Shale Cores
This is a new extraction and analytical technique that was developed to estimate the relative amounts of light mobile oil and heavy non-mobile oil in shale cores to improve EUR calculations. Crushed and ground shale core is extracted using both polar and non-polar solvents to remove heavy (asphaltenes) and light oils. It is assumed that the heavier oil will be left behind in the reservoir and the light oil will be mobile and therefore producible. The extracts are analyzed by both Synchronous Scanned Fluorescence and C8 to C40 analysis by GC-FID to estimate heavy and light oil concentrations in the shale cores.
Vegetation Tissue
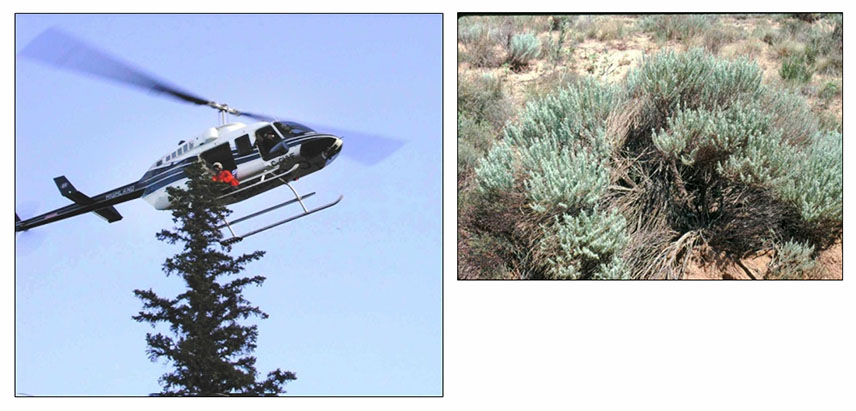
Vegetation tissue can be a useful sample medium in geochemical exploration surveys, provided a certain species is widespread over the survey area. Generally, the twigs and/or leaves of trees and shrubs are collected with pruning shears on the ground or from the skids of helicopters (Figure 5). The samples are generally ashed prior to multi-element analysis as a pre-concentration method. The vegetation tissue are analyzed for multiple elements through acid digestion and ICP/ES-MS finish (Table 2).
Some workers have observed stressed sagebrush over the Patrick Draw oil field in Wyoming and attributed this to the seepage of injected produced water and gas, which created anoxic and alkaline conditions in the soil that was toxic to the sagebrush (Arp, 1992). Klusman et al (1985) observed an increase in the uptake of transition metals and decrease in alkaline earth elements in Fourwing Saltbush over the Eagle Springs oil field in Nevada. Roeming and Donovan (1985) documented an increase of iron and manganese in Silver Sagebrush leaves over the Bell Creek oil field in Montana.
FIGURE 5 / Vegetation tissue can be collected from the skid of a helicopter or on the ground with pruning shears. The leaves and/or twigs are analyzed for major and trace elements.
Hypothetical Survey Designs
In a temperate zones with abundant lakes and target oil reservoirs that are 1 km across (based on previous seismic surveys), one might choose lake sediments to be collected at 500 meter intervals to allow for the chance of at least two anomalous samples over the target reservoirs. The desorbed headspace gas from the lake sediments would be analyzed for C1 to C5 alkanes to look for thermogenic hydrocarbon microseeps and perhaps the magnitude of C1/C2 or C2/C3 ratios (Pixler, 1969) in the microseeps would be indicative of reservoir fluid composition (i.e. oil vs. gas). In this case, the terrain, target size and sought after reservoir fluid dictated the sample medium, collection interval and analytical method.
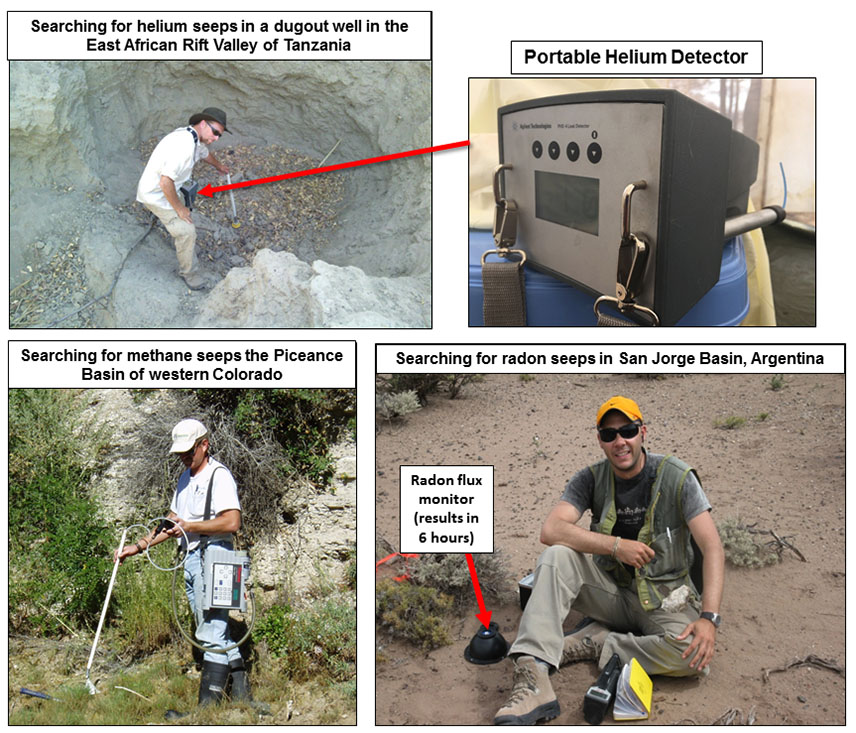
If the target were helium, then free soil gas samples would be collected (>100 cm depth) at an interval that will allow for at least two consecutive anomalies over the target area. Pre-screening the survey area with portable helium detector with a 2 parts per million detection limit (Figure 6) would help find faults and focus the soil gas sample collection. The free gas samples would be analyzed for helium and any other compounds suspected to be in the reservoir (e.g. methane, CO2, etc.). If the area was saturated, then groundwater could be collected for dissolved helium analysis.
In the exploration for roll-front uranium deposits in an arid environment, a free soil gas medium would be the preferred sample medium for helium and radon, which are uranium decay products and therefore pathfinders to mineralization. A portable method (e.g. alpha scintillometer or passive radon flux monitors (Figure 6) should be used for the detection and quantification of 222Rn in soil gas as this decay product only has a half-life of 3.8 days.
FIGURE 6 / Real-time detection of helium, hydrocarbon and radon macroseeps in the field for mapping faults and focusing collection of soil gas samples.
Data Interpretation and Reporting
The hydrocarbon, fixed gas and/or and major/trace element concentration and ratio data are evaluated in frequency distributions to separate populations and determine breakpoints between background and anomalous conditions. Multivariate statistical methods are used to look for important compound associations within and between the various datasets (e.g. Factor Analysis), and to determine which variables contribute most to discrimination between pre-determined classes. Wherever possible it is important to measure the intensity and composition of microseepage over productive and non-productive reservoirs to develop a discriminant model or linear function using organic and inorganic variables. This model or function can then be used to classify microseepage into “productive or non-productive” categories to make better predictions and help lower risk. Your reservoir objective is therefore distinguished from others based on a compositional “template”.
In addition to the multivariate fingerprinting approach, we evaluate hydrocarbon concentrations and ratios in soils, sediments, free gas as a possible indication of “hydrocarbon charge” in your reservoir. Pixler plots (Pixler, 1969) of hydrocarbon ratios in free, sorbed and/or occluded gases are commonly used to determine the source of the observed microseepage (i.e. oil versus gas). The fluorescence spectra of oil microseeps are compared with produced oil spectra to assign ranks to describe how similar they are (Figure 4). Certain major and trace elements (e.g. Li, Mg, Ba, Ca, Br etc. – see Figure 1) in soils and sediments are used to help locate and map faults and may provide insight into subsurface mineralization (e.g., hydrothermal dolomite) processes and reservoir brine compositions.
Hydrocarbon., fixed gas and major/trace element concentrations, bivariate ratios, factor and discriminant scores, oil ranks and concentrations are plotted as proportional symbols and/or contours on a topographic (or geological/geophysical background if available) background to facilitate interpretation of the microseep data. The data, maps and final written report are provided to the client upon completion of the analyses and interpretation. In the final report, the client is provided with recommendations based on our interpretation of the geochemical data in conjunction with available geological and geophysical information to help focus your exploration program. In addition, you receive geochemical maps and all of the raw data from which these maps are generated for your own verification.
FIGURE 4 / Synchronous Scanned Fluorescence spectra of condensate and crude oil. These fluorescence spectra can be compared and contrasted with micro- and macro-seeps in surface soils and sediments to estimate the likely source of the seeps.

