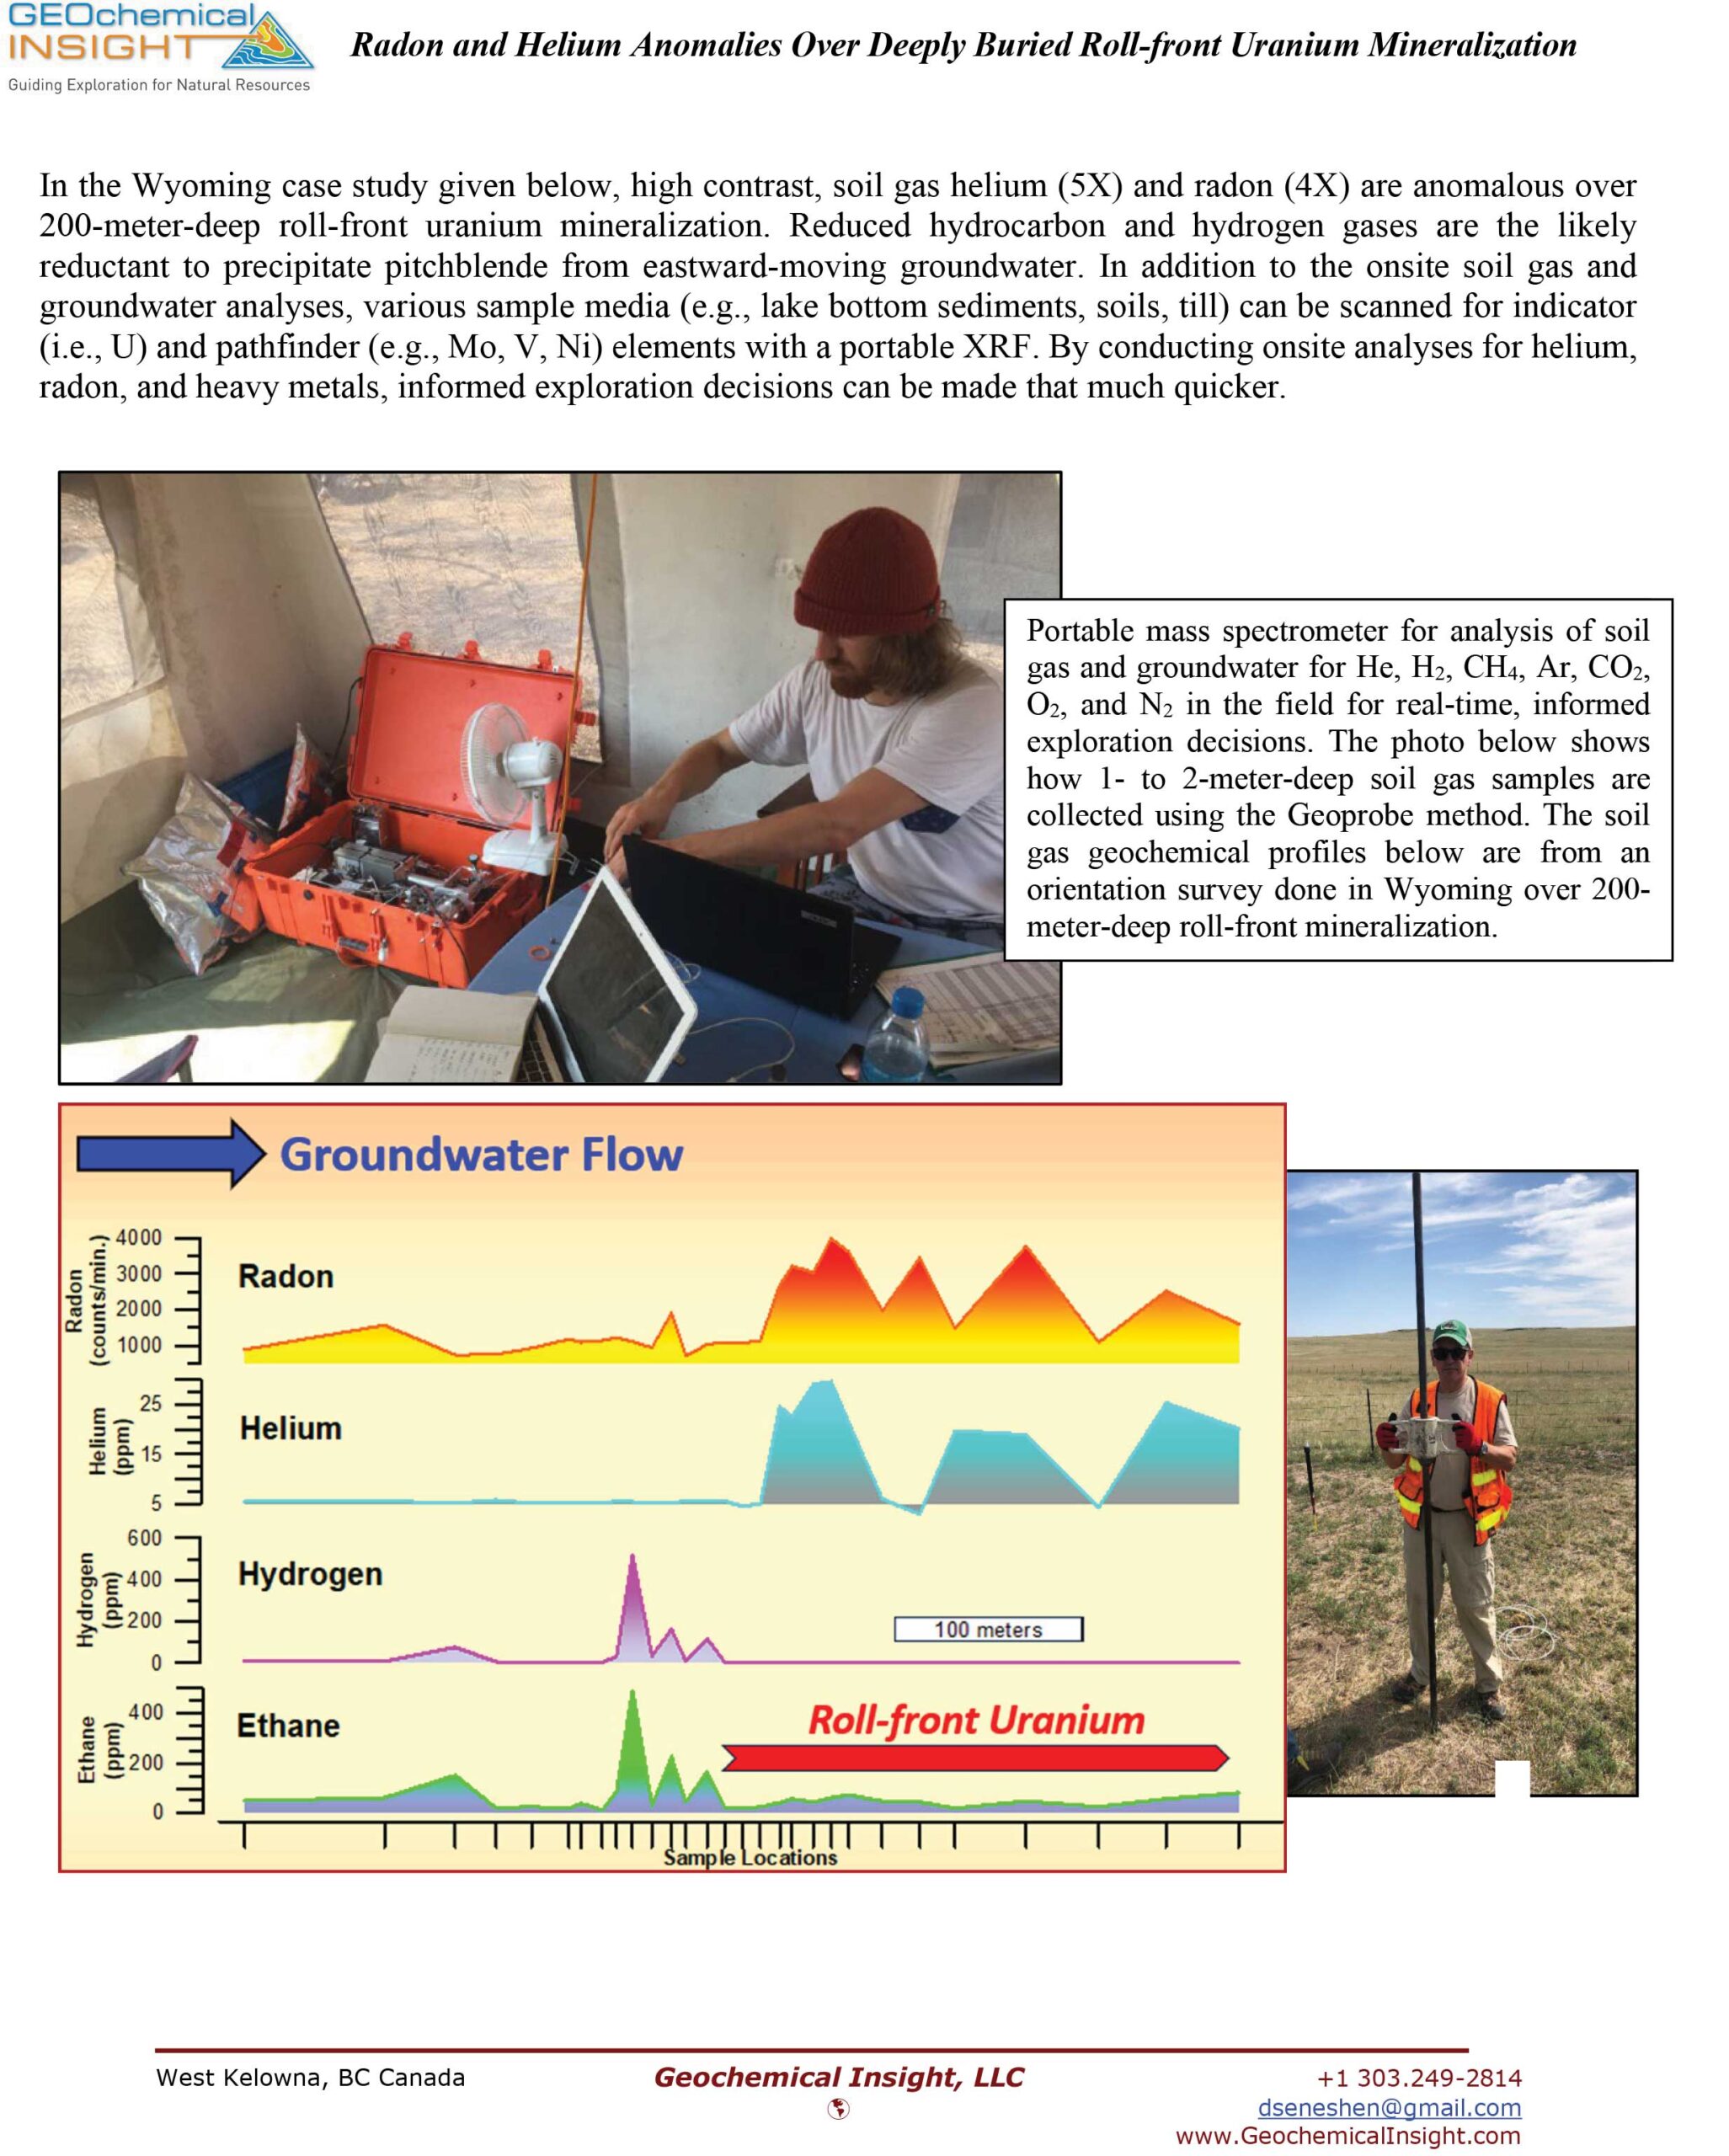
Case studies include geochemical exploration for helium, hydrogen, hydrocarbons and uranium.
Helium Microseeps Directly Over Helium Fields
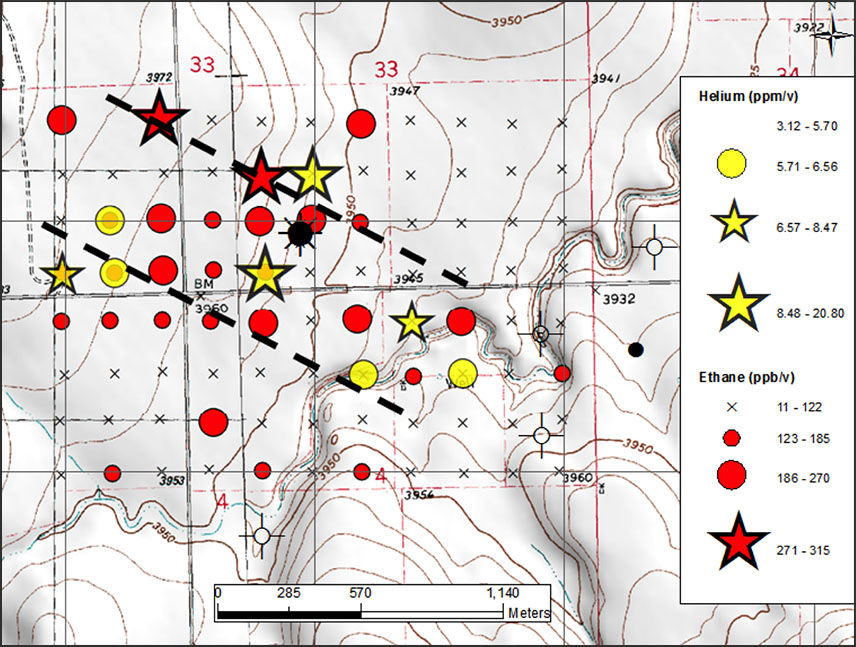
At the Shirley Rother helium/oil field in southeast Colorado (Figure 9), 3 meter deep soil gas samples were collected at 100 meter intervals with a Geoprobe Direct Push drill. High contrast helium and ethane anomalies directly over and adjacent to the 1,500 meter deep Pennsylvanian Morrow channel (Figure 10). This soil gas survey, in conjunction with 3D seismic, would have helped guide the drilling of the Shirley Rother oil well.
FIGURE 9 / Location of Shirley Rother helium/oil field in Cheyenne County, Colorado and produced gas composition.
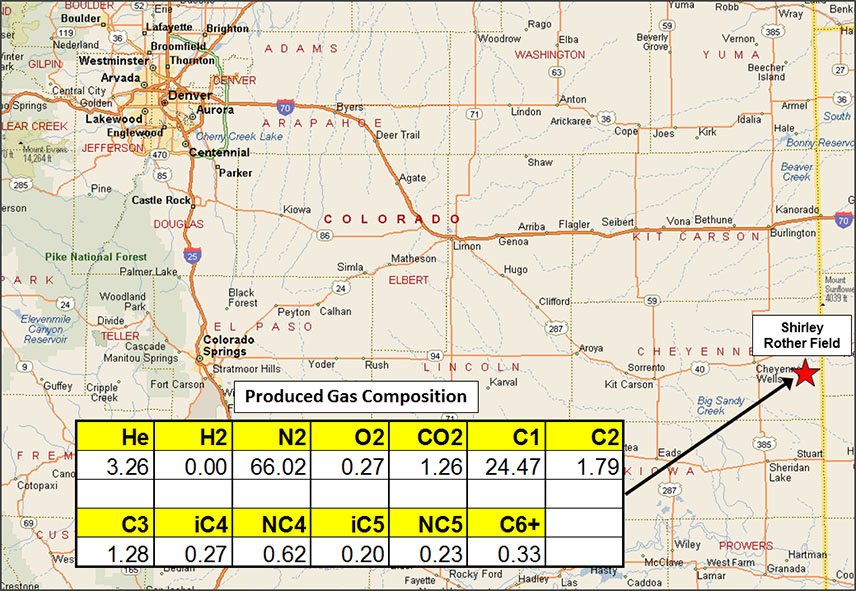
FIGURE 10 / A total of 94, 3-meter deep soil gas samples were collected with a Geoprobe drill at 100 meter intervals over the 1,500-meter deep Shirley Rother helium/oil field in southeast Colorado. Gas is produced a Pennsylvanian Morrow channel sandstone and it contains significant helium (i.e. 3.26%) with the balance consisting of nitrogen, C1-C6 hydrocarbons and minor CO2. The field also produces 17 barrels of oil per day. Two soil gas samples within 100 meters of the producing well contain 8.48 to 20.8 ppm helium and three other samples to the southeast within the channel trend contain 5.71 to 8.47 ppm helium.
Prediction of CO2 in Petroleum Reservoirs with Soil Gas Surveys
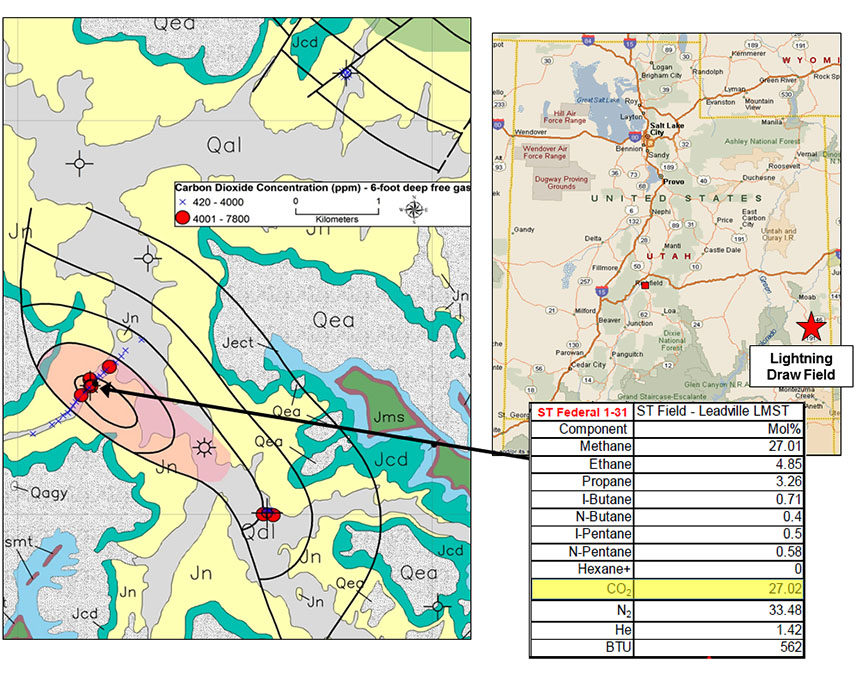
A Geoprobe Direct Push drill was also used to collect 1.8 meter deep soil gas samples at 50 to 100 meter intervals over the 2,500 meter deep, Mississippian Leadville Limestone hosted Lightning Draw SE gas field in the Paradox Basin of southeast Utah (Figure 11). The reservoir contains abundant CO2 (~27 Mol%), and there are CO2 anomalies in soil gas over and adjacent to the producing Federal 1-31 and also around a dry well (2 White Rock Unit 1) down-dip to the southeast. This soil gas survey shows how this tool could help predict the presence of CO2 in the Leadville Limestone reservoir.
FIGURE 11 / Distribution of CO2 in 6-foot deep soil gas over the Lightning Draw helium/condensate field in southeast Utah. Note the high CO2 concentration in the Mississippian Leadville Limestone reservoir, which is leaking to surface.
Dissolved Thermogenic Hydrocarbons Sparks Exploration Interest in Southern Colorado Frontier Basin
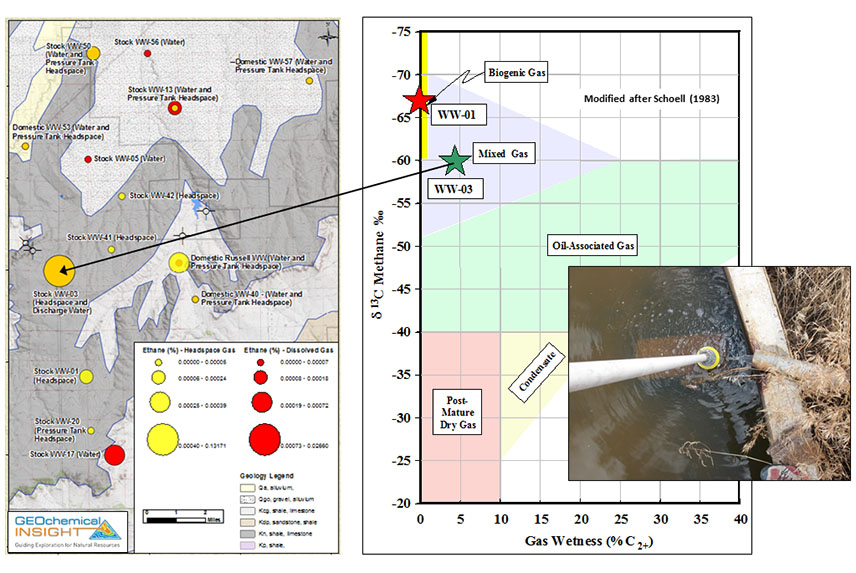
A groundwater based geochemical survey was carried out in southern Colorado to look for the presence of migrated thermogenic hydrocarbons, which, if found, would encourage further exploration here. Groundwater was the preferred sample medium because of the uniform distribution of domestic and stock water wells in the area and there are source rocks at surface that would hinder a surface soil or soil gas survey. USGS NAWQA protocols were used for collection and preservation of the groundwater taken from 14 wells. Headspace gas samples were also collected from the water wells for analysis. The headspace and dissolved gas samples were analyzed alkane and aromatic hydrocarbons and the carbon isotopic ratio of dissolved methane.
Headspace and dissolved ethane anomalies are evident in 5 of the 14 water wells samples (Figure 12). Biogenic methane was noted in most wells, but methane in one of the wells (WW-03) has a mixture of both thermogenic and biogenic gas (Figure 12). Groundwater proved to be a useful medium for conducting this survey as thermogenic hydrocarbons were identified fulfilling the objective of the survey. The groundwater was also a nice alternative to soil and soil gas sample media, which would have been compromised by the presence of petroleum source rocks at surface here.
FIGURE 12 / Distribution of dissolved and headspace ethane in groundwater samples (domestic and stock water wells) from southern Colorado. While the methane in some samples clearly have a biogenic origin while others (like WW-03) contain a mixture of biogenic and thermogenic methane based on the Schoell plot below.
Microseeps Find Commercial Oil Discovery in Michigan Basin
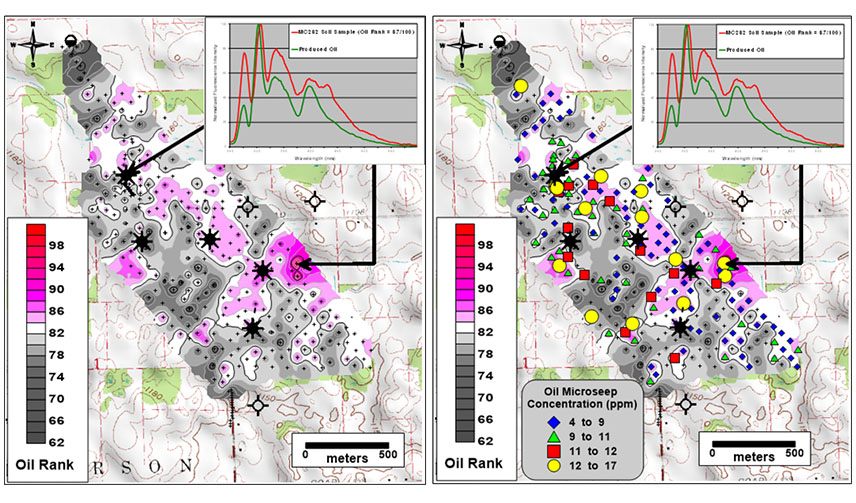
A soil-based geochemical survey was carried out over the southern part of the Albion Scipio trend in southern Michigan (Figure 13). Soil samples were collected from 50 cm depth with a spade at intervals of 15 to 100 meters. The sample intervals were tight in this survey because the 1,200 meter deep Ordovician Trenton hydrothermal dolomite oil reservoirs in this part of the Albion Scipio play are small in size. Soils were chosen as the preferred medium because the high water table in this area did not allow for the collection of soil gas. The soil samples and crude oil from the producing McArthur well were analyzed by the Synchronous Scanned Fluorescence (SSF) method and several northwest trending oil microseeps were identified. The oil microseeps were defined on the basis fluorescence spectral patterns being very similar to the produced oil from the McArthur well (Figure 13). Subsequent drilling directly over or immediately adjacent to the oil microseeps resulted in commercial oil discoveries (Figure 14). Wells drilled off the microseeps in 3D seismic anomalies were dry or had minor oil shows. This is an impressive “before and after” case study that shows the benefit of conducting geochemical surveys in conjunction with seismic prior to drilling. The survey also emphasizes the ability of the SSF method to find low concentration microseeps (4 to 17 parts per million oil in soils – see Figure 14).
FIGURE 13 / A detailed soil fluorescence geochemical survey was carried out over the 1,200 meter (~4,000 feet) deep, oil-charged, Ordovician Trenton, hydrothermal dolomite hosted Albion-Scipio reservoir in southern Michigan. Soils were collected at 30 centimeter (20-inch) depth at 5 to 15 meter (~50 to 300-foot) intervals and analyzed by solvent extraction and Synchronous Scanned Fluorescence along with a produced oil sample. Oil microseeps in soils have fluorescence patterns that are similar to the produced oil (i.e. high oil rank) and they trend northwest for the most part. Some of these microseeps were drilled in conjunction with 3D seismic information.
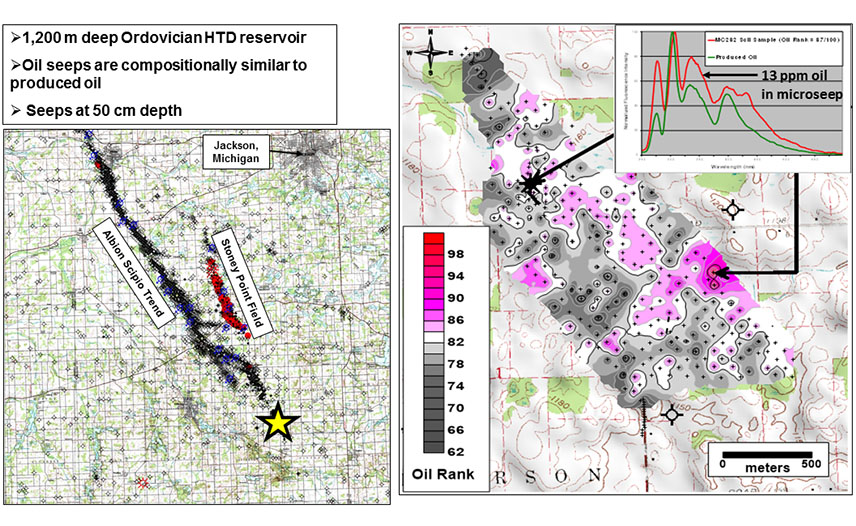
FIGURE 14 / Post-survey wells drilled on or adjacent to the oil microseeps after the geochemical survey intersected commercial oil-charged hydrothermal dolomite reservoirs. Those drilled away from the seeps were dry or had minor oil shows. These are labeled as oil microseeps because of their low concentrations (i.e. 4 to 17 parts per million).
Light Oil Microseeps over the 100 MMBO Covenant Oil Field
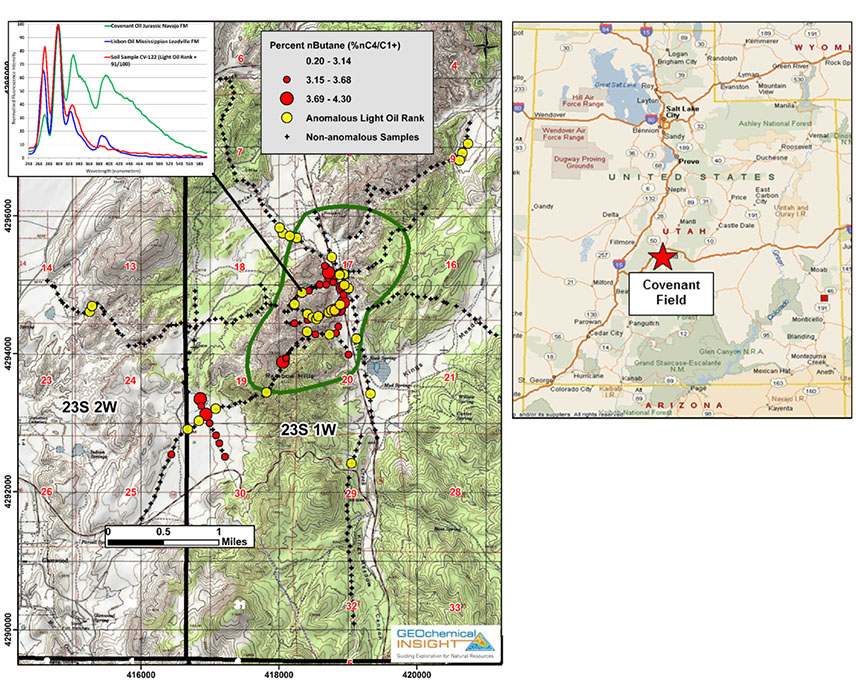
The Covenant oil field, which was discovered in 2004 by Wolverine Oil & Gas, is located in the Central Utah Thrust Belt (aka “Hingeline”) in south-central Utah (Figure 15). To date the field has produced about 5 MMBO of oil (no gas) from the 1,900-meter deep Jurassic Navajo Sandstone. Oil in place is estimated at 100 MMBO with a 40% recovery factor. Net reservoir thickness is 129 meters over a 960-acre area. Approximately 300 shallow (50 cm) soil samples were collected over and around the field at about 200-meter intervals (Figure 15). Soils were chosen as the preferred medium because shallow bedrock precluded probing for soil gas and water wells were insufficient for using groundwater as a medium. Percent nButane (gas wetness ratio) is anomalous over the center and southern parts of the field and also off the field to the southwest near the surface projection of a wrench fault. Well defined high gravity oil microseeps are also evident ion soils over and to the southwest of the field, but they are lighter in composition (~540 API gravity) compared with the produced Covenant oil (~400 API gravity). The oil microseeps look more like oil from the Mississippian Leadville Limestone hosted reservoir.
FIGURE 15 / The Covenant oil field, which was discovered in 2004 by Wolverine Oil & Gas, is located in the Central Utah Thrust Belt (aka “Hingeline”) in south-central Utah. To date the field has produced about 5 MMBO of oil (no gas) from the 1,900-meter deep Jurassic Navajo Sandstone. Oil in place is estimated at 100 MMBO with a 40% recovery factor. Net reservoir thickness is 129 meters over a 960-acre area. Approximately 300 shallow (50 cm) soil samples were collected over and around the field at about 200-meter intervals. The percent nButane (gas wetness ratio) is anomalous over the center and southern parts of the field and also off the field to the southwest. Well defined high gravity oil microseeps are also evident ion soils over and to the southwest of the field, but they are lighter in composition (~540 API gravity) compared with the produced Covenant oil (~400 API gravity). The oil microseeps look more like oil from the Mississippian Leadville Limestone hosted reservoir.
Oil Sourced Microseeps over the 10 MMBO Sorrento Field
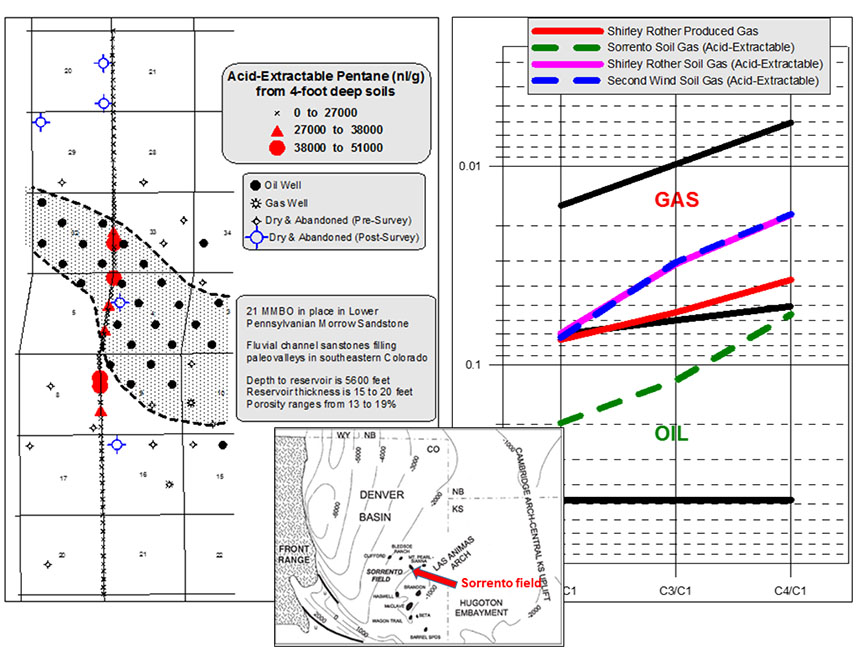
A soil based geochemical survey was carried out over the 1,700 meter deep, Pennsylvanian, Morrow sandstone hosted Sorrento oil field in southeast Colorado (Figure 14). Four foot deep soil samples were collected with a hand auger at 160 meter intervals along an 11 km long line over the 21 MMBO oil field (Figure 16). Deep soils were chosen to ensure the presence of carbonate for dissolution in acid and release of occluded hydrocarbons. The soils were analyzed for acid-extractable (occluded) C1-C5 hydrocarbons (Table 2). Anomalous pentane (C5) concentrations are evident in 6 samples over the field and 3 samples 600 to 1,100 meters south of the field (Figure 14). An inverted Pixler plot of the C2/C1, C3/C1 and C4/C1 ratios in the acid-extractable gas from an anomalous sample over the field reveals that the pentane is leaking from an oil source, which makes sense since Sorrento is an oil field (Figure 16). This emphasizes the value of Pixler plots for estimating reservoir fluid compositions from gas ratios in surface microseeps.
FIGURE 16 / Acid-extractable pentane (C5) anomalies in 4-foot deep soils collected at 1/10-mile intervals over the 5,600-foot deep Sorrento Oil Field in Southeast Colorado. The Pixler plot confirms the microseeps over Sorrento are derived from an oil source.
Trace Element Anomalies in Soils Match
Oil Field Water Composition
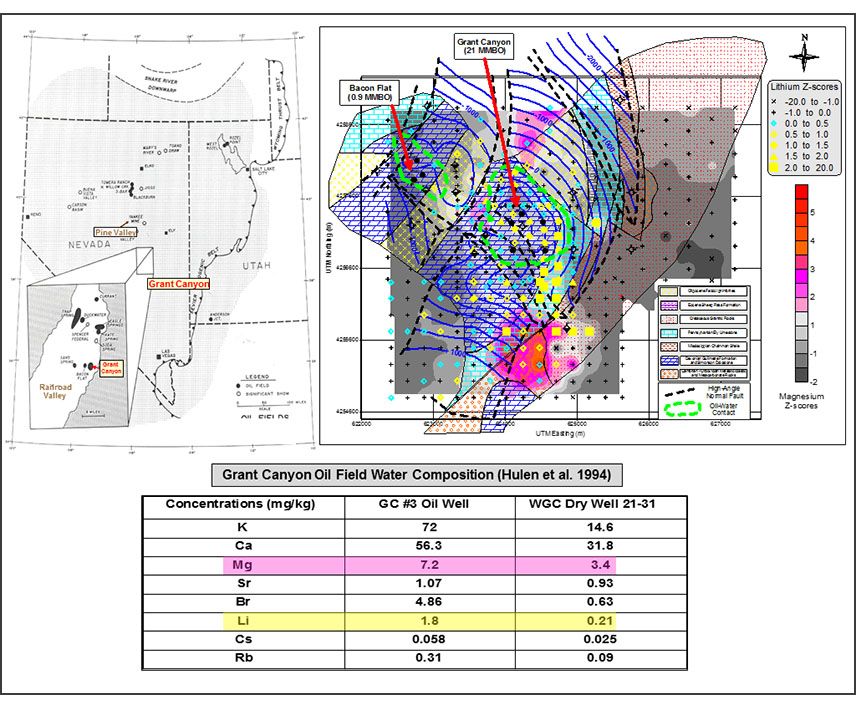
21 MMBO Grant Canyon Oil Field (Nevada) A soil based geochemical survey was carried out over and around the 21 MMBO, 1,340 meter deep, Devonian Guilmette dolomite hosted Grant Canyon oil field in Railroad Valley, Nevada (Figure 17). Soil samples, which were collected from 50 cm depth at 320 meter intervals over and around the field, were analyzed for major and trace elements (Figure 17). The map in Figure 17 shows a plot of standardized (Z-transformation) magnesium (contours) and lithium (proportional symbols) concentrations. Lithium anomalies are spatially associated with high angle faults over and south of the field. Magnesium anomalies occur over and adjacent to high angle faults to the south, north and along the western margin of the oil field (Figure 17). The produced water from the Grant Canyon field contains 9 times more lithium and 2 times more magnesium that a dry dolomite reservoir (WGC Dry Well 21-31). The lithium and magnesium anomalies associated over and around Grant Canyon is therefore related to leakage of oil field waters along faults. The unique composition of oil field waters at Grant Canyon compared with dry reservoirs, suggests this geochemical method could be useful in finding other Grant Canyon-like oil fields.
FIGURE 17 / Distribution of near-total lithium and magnesium concentrations in soils over and around the Grant Canyon oil field, Nye County, Nevada. Note the spatial correlation of lithium and magnesium with high angle faults over and adjacent to the oil field. Produced water from a productive well (e.g. GC #3) contain about nine times as much lithium and twice as much magnesium as a dry well (e.g. WGC 21-31) – see table with produced water composition. The lithium and magnesium anomalies in soils therefore probably reflect leakage of produced water along high angle normal faults.
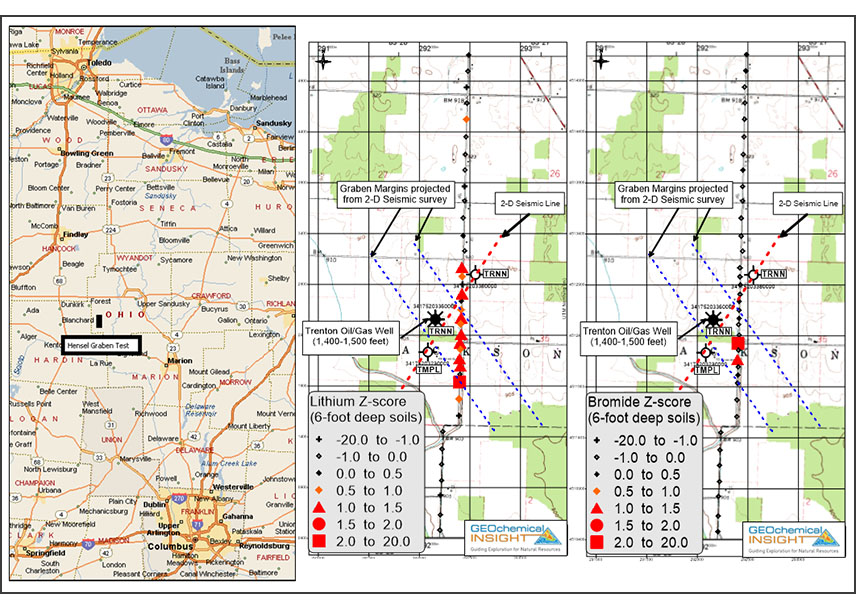
Hensel Graben Oil & Gas (Ohio) Deep (1.8 meter) soil samples were collected with a Geoprobe Direct Push drill at 80 to 160 meter intervals across a 440 meter deep, Ordovician, Trenton, oil and gas charged hydrothermal dolomite reservoir in the northwest trending Hensel graben (Figure 18). Standardized (Z-transformation) lithium concentration anomalies are found in almost every sample over the graben and up to 800 meters north of the graben edge (Figure 18). Bromide is anomalous in 2 deep soil samples directly over the graben (Figure 18). Produced water compositions were not available, but it is highly probable that the lithium and bromide anomalies reflect leaking oil field water along faults within and outside the graben.
FIGURE 18 / Distribution of water-extractable lithium and bromide concentrations in soils over and around oil and gas charged hydrothermal dolomite in the Hensel Graben in Wyandot County, Ohio. Although produced water composition is not available, it is assumed that the close spatial correlation of the lithium and bromide anomalies over the Hensel Graben reflect leakage of produced water. There are also heptane (C7) microseeps over the margins of the graben.
Finding Sweet Spots and Mapping Structures
over Unconventional Oil & Gas Plays
Jonah Tight Gas Sand Field (Wyoming) 30 cm soil samples were collected 1 km intervals over and around the 10 TCF, Cretaceous Lance sandstone hosted Jonah gas field in Sublette County, Wyoming (Figure 19). Only shallow (30 cm) soils were available over and around Jonah because bedrock is very close to surface. The samples were analyzed by the headspace (sorbed) method for C1-C5 hydrocarbons (Table 2). The over-pressured (0.55 to 0.7 psi/ft) gas field covers an area of about 2 townships, so 1 km sample intervals were more than adequate for identifying hydrocarbon anomalies. The produced gas composition indicates about 7% wetness, so Jonah is by no means a dry gas field (Figure 19). In fact, a contour plot of a wet gas ratio (%iC5) reveals anomalies mainly over the fault-bounded field where the Lance Formation is both over-pressured and productive (Figure 20). Soils over the Jonah field, therefore have a “wetter” gas composition than those off the field where the Lance is normally pressured and non-productive. The over-pressure at Jonah probably “pushes” wet gases to surface as opposed to normal pressured areas outside the field. It is interesting to note that the Palomino dry well, about 15 km west of Jonah, was drilled in a 3D seismic feature with no corresponding surface geochemical anomalies (Figure 20).
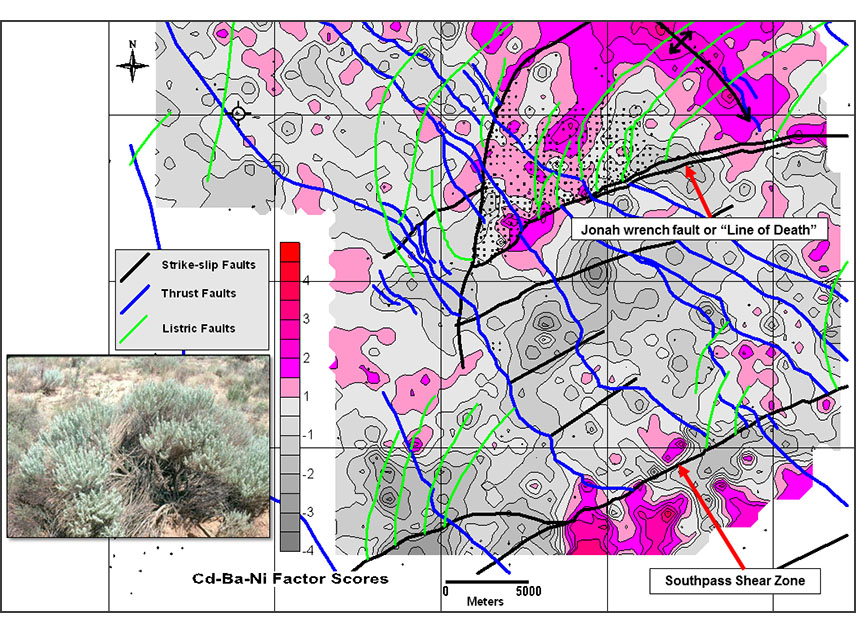
Big Sagebrush (Artemisia tridentata) leaves were collected at 1 km intervals over an 11 township area over and to the west and south of the Jonah gas field in Sublette County, Wyoming (Figure 21). The samples were dried, ground, digested in nitric acid and analyzed by ICP/ES-MS for 53 elements. An interesting element association was reveled through factor analysis of the multi-element data. The factor or element association shows high loadings for cadmium, barium and nickel, meaning a high degree of correlation of these elements with this factor. Factor scores, which increase as element correlations increase (i.e. Cd, Ba and Ni all increase in concentration together in a particular sample), are highest over the Jonah field, along the axis of the Pinedale Anticline and over and adjacent to the Southpass Shear Zone in the southern part of the survey area (Figure 21). The origin of this element association is unclear, but more permeable structures (e.g. extension along hinge of Pinedale Anticline) in these anomalous areas may allow for seepage of formation waters enriched in cadmium, barium and nickel. The Big Sagebrush growing over the more permeable structures would therefore uptake more of these heavy metals and exude them through their leaves.
FIGURE 19 / Distribution of 1,000 m spaced, 1-foot deep soil samples over the 10 TCF Jonah Tight Gas Field in Sublette Country, Wyoming. Produced gas composition indicates high (>7%) gas wetness.
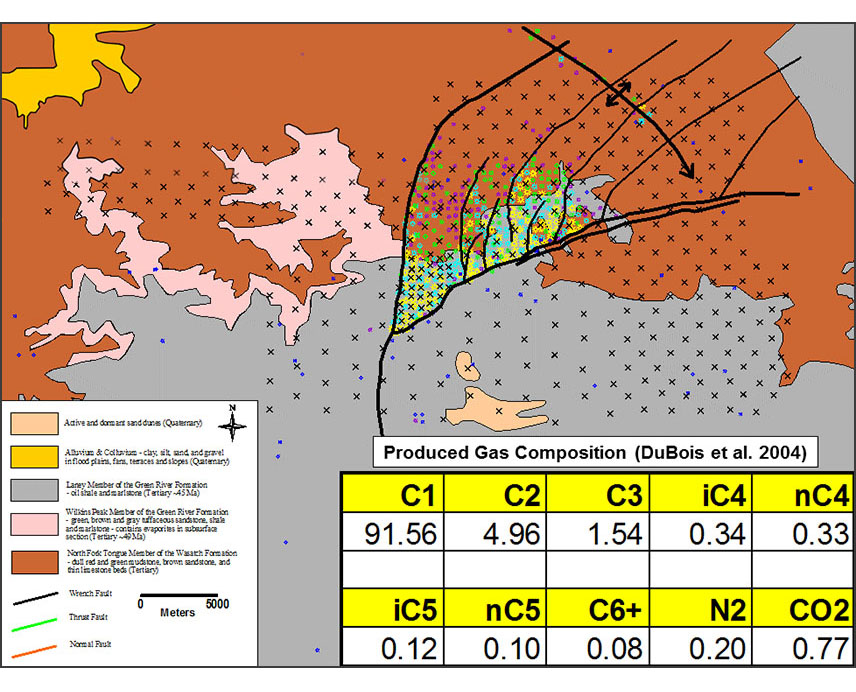
FIGURE 20 / The Jonah gas field is an 8,500-foot deep, basin-centered tight-gas sand accumulation (10 TCF) within over-pressured (0.55 to 0.7 psi/ft) Upper Cretaceous fluvial strata of the Lance Formation and upper Mesaverde Group of the Green River Basin in Sublette County of west-central Wyoming. Productive sandstones in the Lance Formation at Jonah are extremely tight with porosity ranging from 8% to 12% and permeability from 3 to 20 microdarcies. The left-lateral wrench fault at the southern boundary of the field may have produced fractures that are responsible for the shallower, 2500-foot thick gas column and apparent higher permeability at Jonah compared with other parts of the basin.
Geochemical Insight conducted a multi-township soil geochemical survey over and around the field. 30-centimeter deep soil samples were collected at 1-kilometer intervals over and off the field. The iso-pentane percentage (iC5/C1+ x 100) in soils is higher over the over-pressured field relative to normal pressured outside the field. The overpressure at Jonah pushed heavier (liquid) C5 alkanes to surface relative to normal pressured areas where these anomalies are not evident.
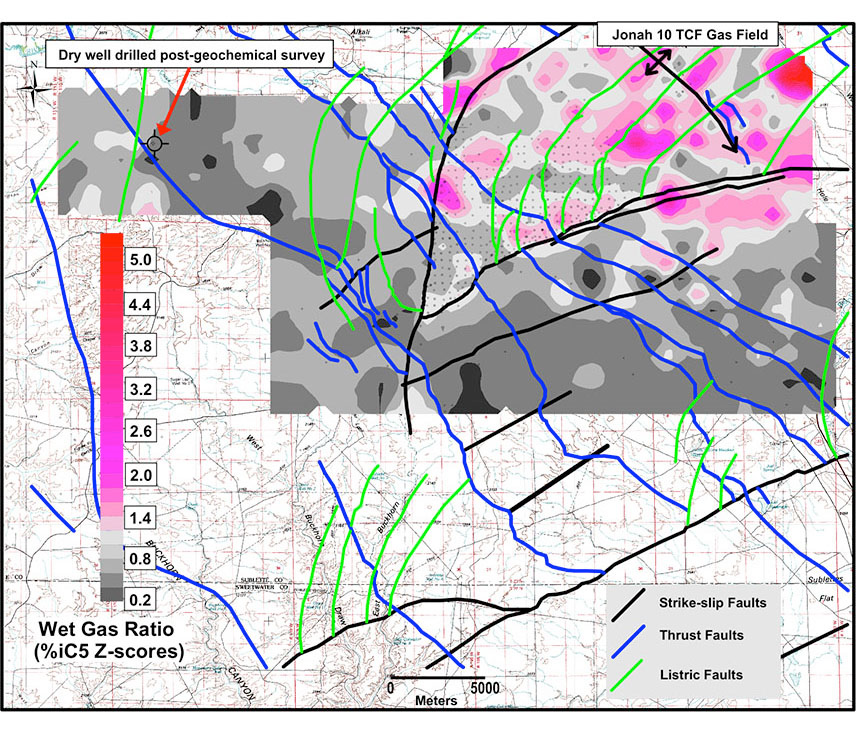
FIGURE 21 / Distribution of cadmium-barium-nickel factor scores in “Big Sagebrush” (Artemisia tridentata) over and around the 10 TCF Jonah tight gas sand field in Sublette County, Wyoming. High factor scores mean that cadmium, barium and nickel are associated and their concentrations increase together in particular samples over the Jonah field, southern termination of the Pinedale anticline and the “South Pass” shear zone in the southern part of the map area.
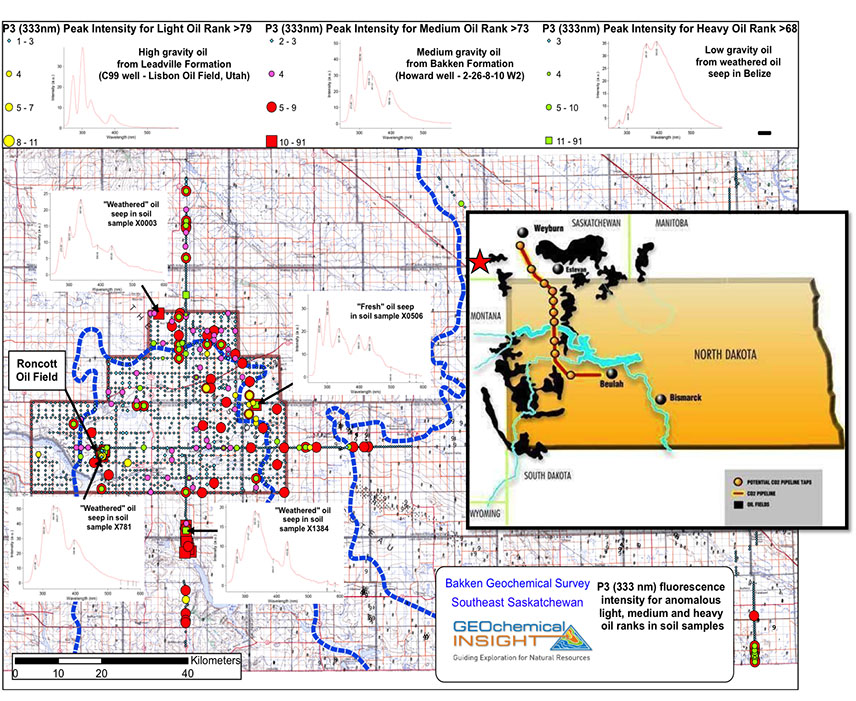
Bakken Roncott Oil Field (SE Saskatchewan) A multi-township soil-based geochemical survey was conducted over and around the 800 meter deep Bakken sandstone hosted Roncott oil field in southeast Saskatchewan (Figure 22). Soil samples were collected from 50 cm depth on 1 kilometer centers over approximately 19 townships and they were analyzed by the SSF method. Soils were chosen for this regional survey because water wells were not available for sampling and the high water table and clay-rich soils in this area precluded the collection of soil gas. Fresh to weathered oil microseeps are evident over and around the Roncott oil field and they also cluster along the Prairie Evaporite Salt Dissolution edge (blue dashed line) in the northeast part of the survey area (Figure 22). The recent and ongoing collapse of formations above the dissolved salt has created faults along which oil can migrate to surface. The collapse and faulting has also created structural traps in the Bakken, so the microseeps at surface not only maps the salt dissolution edge, but they could also point to potential drill targets in the Bakken.
FIGURE 22 / Distribution of light (fresh) to heavy (biodegrated) oil microseeps over and around the Roncott oil field in southeast Saskatchewan. Oil microseeps are spatially associated with the Roncott Oil field and the faulted, Prairie Evaporite, salt dissolution edge (blue dashed line).
Generation and Migration (microseepage) of
Light Oil in Remote Eastern Mongolian Basins
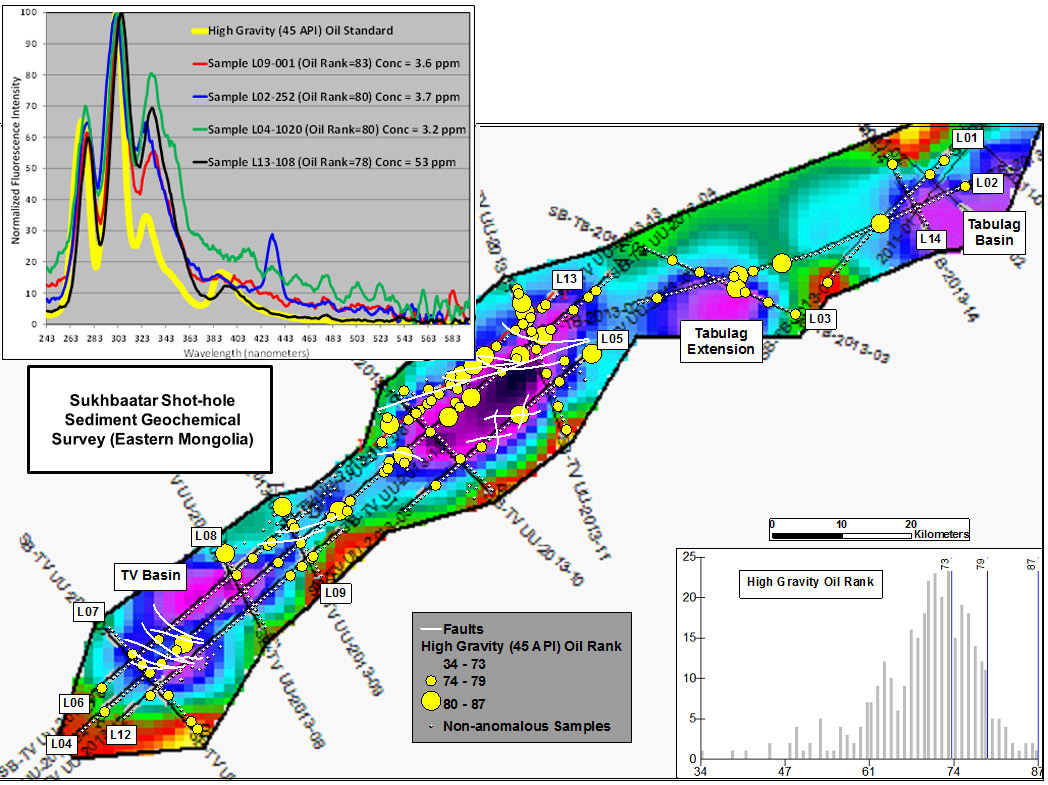
A shot-hole sediment based hydrocarbon geochemical survey was carried out in remote eastern Mongolia to look for migrated thermogenic hydrocarbons to support the existence of a petroleum system (Figure 23). A total of 639, 15 meter deep, shot-hole sediments were collected at 720 meter intervals along 460 km of seismic lines by the seismic crew. The samples were analyzed by both the acid-extractable (occluded) hydrocarbon and SSF methods. Figure 20 shows a proportional symbol plot of log-transformed C2+ hydrocarbon concentrations in shot-hole sediments. There is good spatial correlation of the C2+ anomalies with normal faults over and at the margins of the UU and TV Basins (Figure 24). This correlation also apparent on the C2+ profile over the 100 km long (Line 4) seismic section (Figure 25). In addition to proving the existence of a petroleum system in this remote part of Mongolia, the client also need to know if the hydrocarbon microseepage was coming from an oil or gas source. A Pixler plot of C1/C2, C1/C3 and C1/C4 ratios reveals that the microseepage is leaking from a dominantly oil and “gassy oil (condensate)” source (Figure 26). The presence of a light oil source in the UU and TV basins is further confirmed by the high gravity oil microseeps identified by SSF analysis of the shot-hole sediments (Figure 27). This was very encouraging news for the client as the lack of infrastructure (i.e. pipelines) in this part of Mongolia would preclude the production of gas from the Sukhbaatar exploration block.
FIGURE 23 / Location of Sukhbaatar Shot-hole Sediment Geochemical Survey (Eastern Mongolia).
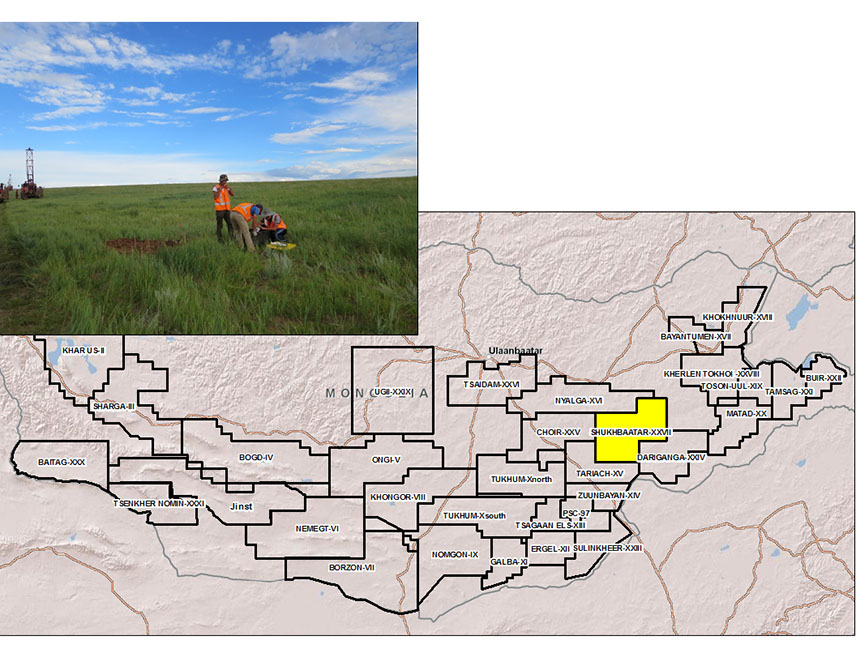
FIGURE 24 / A total of 639, 15-meter deep shot-hole sediments over a 1,000 km2 area for volatile and liquid hydrocarbon analysis. The shot-hole sediments were collected at 720-meter intervals along 460 km of seismic lines. Acid-extractable log C2+ concentration anomalies are spatially correlated with faults over and adjacent to the “UU and TV” Basins.
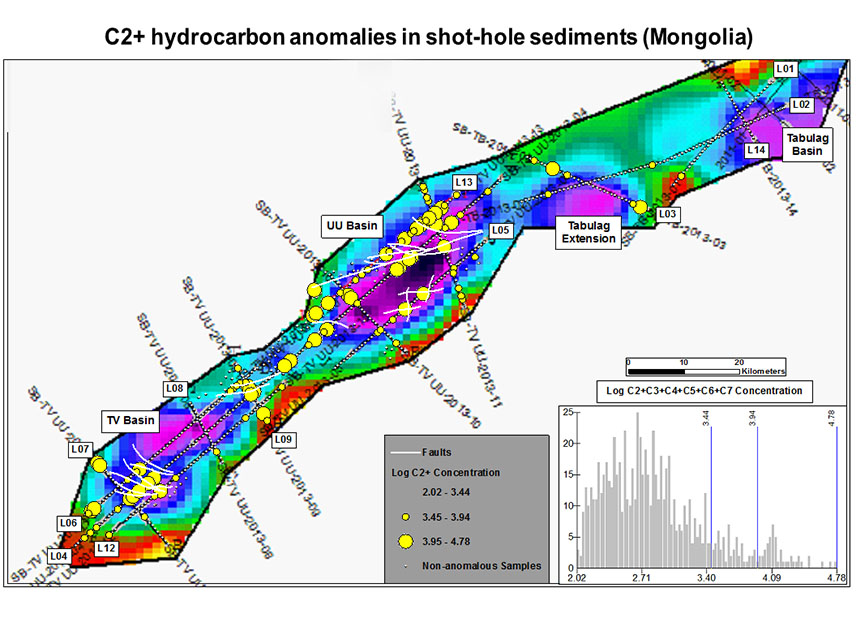
FIGURE 25 / Acid-extractable log C2+ concentration anomalies are spatially correlated with faults over and adjacent to the “UU and TV” Basins as shown along the Line 4 seismic section.
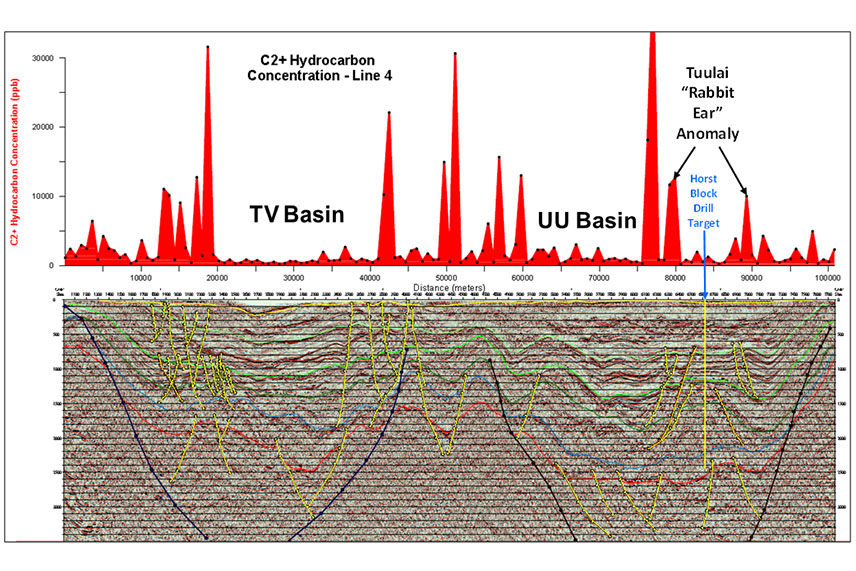
FIGURE 26 / Distribution of oil and gas sourced microseeps based on the C1/C2 ratio (Pixler, 1969) in microseeps with log C5+>2.65.
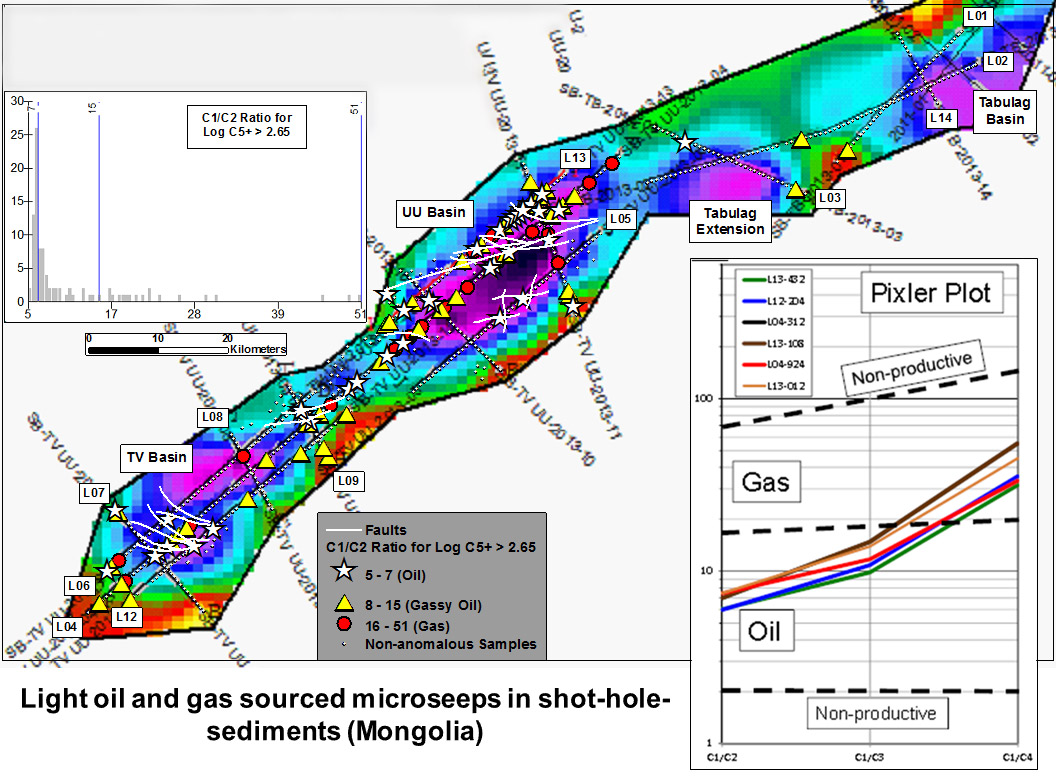
FIGURE 27 / Distribution of “high gravity” oil microseeps in639, 15 meters deep shot-hole sediments over the TV and UU Basins in eastern Mongolia. The microseeps are spatially correlated with faults over and adjacent to the TV and UU Basins that were identified on 2D seismic sections.
Regional Geochemical Tool for
Reducing Exploration Risk in the Arctic
Lake bottom sediments were the preferred samples medium for regional geochemical surveys in this area with 100 to 600 meters of permafrost because they are thermal windows through the permafrost (does not impede hydrocarbon microseepage) and because of their accessibility, shallow depth and uniform distribution (Figures 28 and 29). The survey was carried out to find a regional geochemical tool to focus oil & gas exploration in this remote area as seismic and drilling are prohibitively expensive.
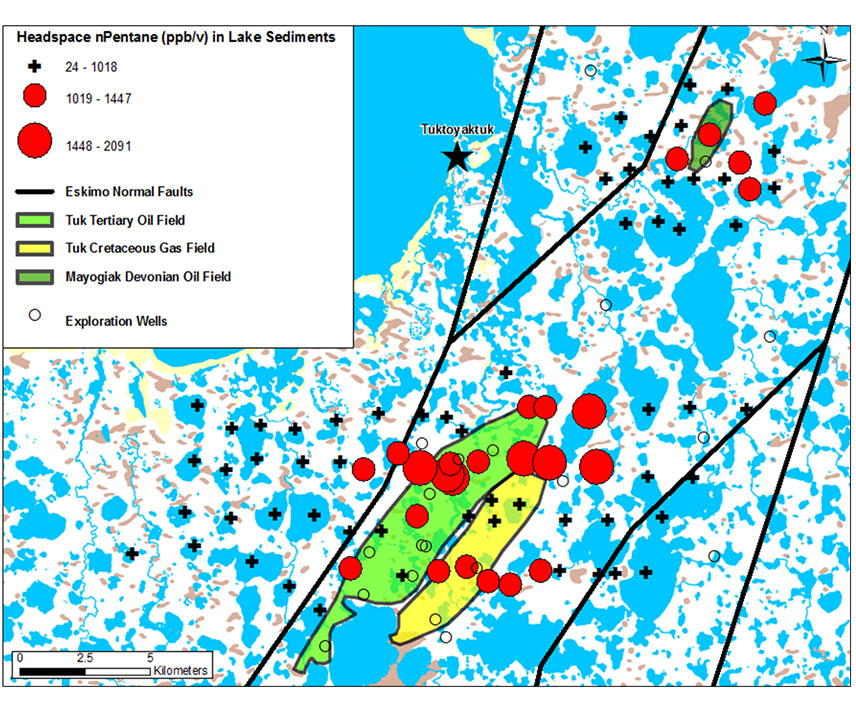
Lake sediments were collected over and around the 3,000 meter deep, Cretaceous Tuk gas field (280 BCF), the 1,500 meter deep, Tertiary biodegraded Tuk oil field (10-25 MMBO) and the 1,200 meter deep, Devonian, Mayogiak oil field (4 MMBO). A total of 85 sediment samples were collected at approximately 1 km intervals from 30 to 60 cm below the lake floors with a 30 kg gravity corer that was dropped of the pontoon of a helicopter. Bactericide and deionized water were added to the sampling cans and they were sealed immediately with a canning machine onboard the helicopter. The samples were analyzed for headspace C1-C5 hydrocarbons with a GC-FID back at the laboratory. Figure 29 shows a proportional symbol plot of headspace pentane (C5) concentrations in the lake sediments. In general, there is good spatially correlation of pentane anomalies with the oil and gas fields and, while anomalies not perfectly centered over the fields, this regional geochemical tool would certainly help focus lease acquisition, seismic, and drilling in this vast area for much less cost.
FIGURE 28 / Photograph of a “Pingo” near the Tuk Gas Field in NWT, Canada. Uniform distribution of glacial lakes (thermal windows through permafrost) and easy access to lakes by helicopter are the reasons lake sediments were chosen for the regional geochemical survey.
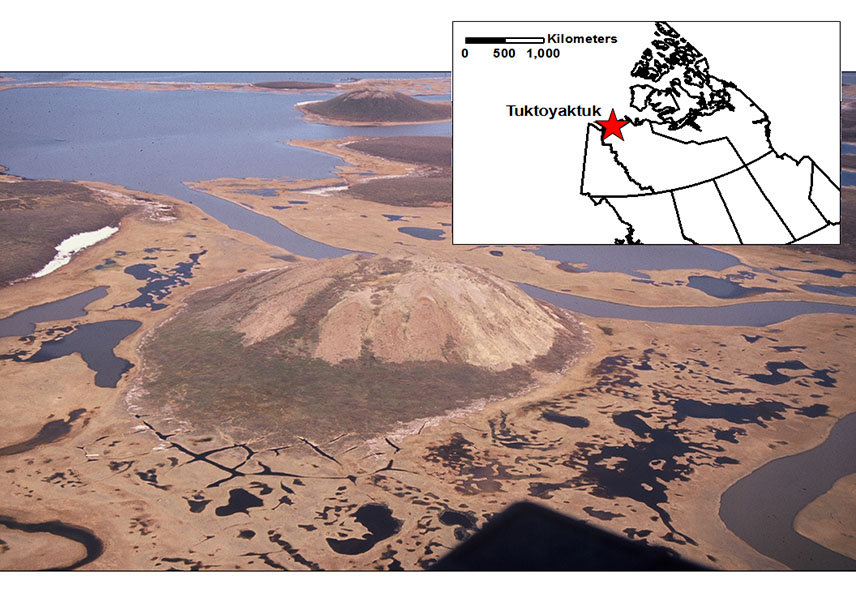
FIGURE 29 / Distribution pentane (C5) anomalies in the headspace of lake sediments collected at about 1 km intervals over the Tuk and Mayogiak fields in northern Canada. Note the spatial correlation of the pentane (C5) anomalies with the oil & gas fields.
Estimating Light Moveable Oil in Shale Cores
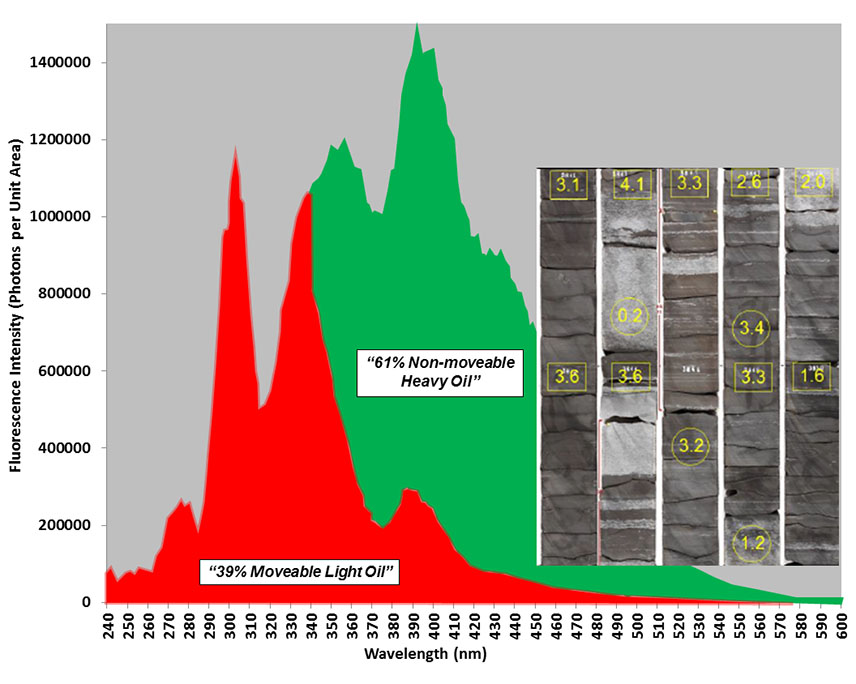
As mentioned previously, this is a new extraction and analytical technique that was developed to estimate the relative amounts of mobile light oil and non-mobile heavy oil in shale cores to improve EUR calculations. Crushed and ground shale cores are extracted using both polar and non-polar solvents to remove heavy (asphaltenes) and light oils. It is assumed that the heavier oil will be left behind in the reservoir and the light oil will be mobile and therefore producible. The extracts are analyzed by both Synchronous Scanned Fluorescence and C8 to C40 analysis by GC-FID to estimate heavy and light oil concentrations in the shale cores. Figure 30 shows fluorescence spectra from polar and non-polar extracts of a shale core. The weight percent oil in each phase can be calculated by comparison of fluorescence responses of crude oil standard with known concentrations. The relative amounts of mobile and non-mobile oil in the shale core sample are shown in Figure 30. This method has been tested on several shale cores, but the results remain proprietary at this time.
FIGURE 30 / Fluorescence spectra from moveable and non-moveable oil in a shale core sample.
